The 2017 Weekly Market Report was emailed to CAI members every Tuesday during the season.
Below is a series of charts indicating the 2017 Average Weekly Wholesale Market Prices and Tonnages transported from NE Victoria.
Data was collected by Chestnuts Australia Inc. from a number of sources.
Charts 1 to 4 show the prices achieved across the season within each of the wholesale markets reported on.
Chart 5 is information gathered from the major transport company from NE Victoria ONLY. (This is not the complete numbers for Australia).
Chart 1
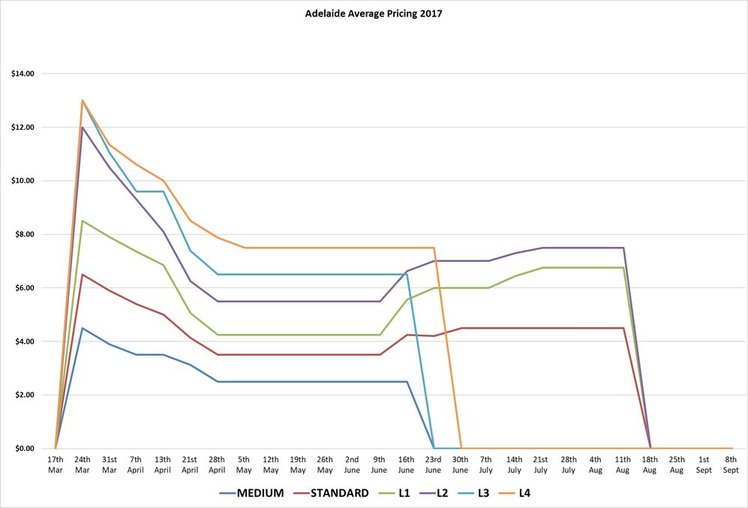
Chart 2
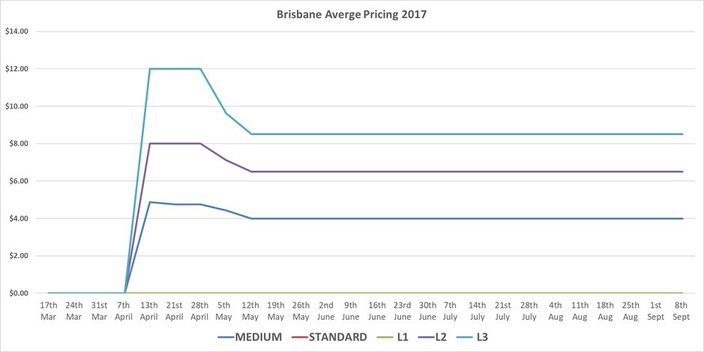
Chart 3
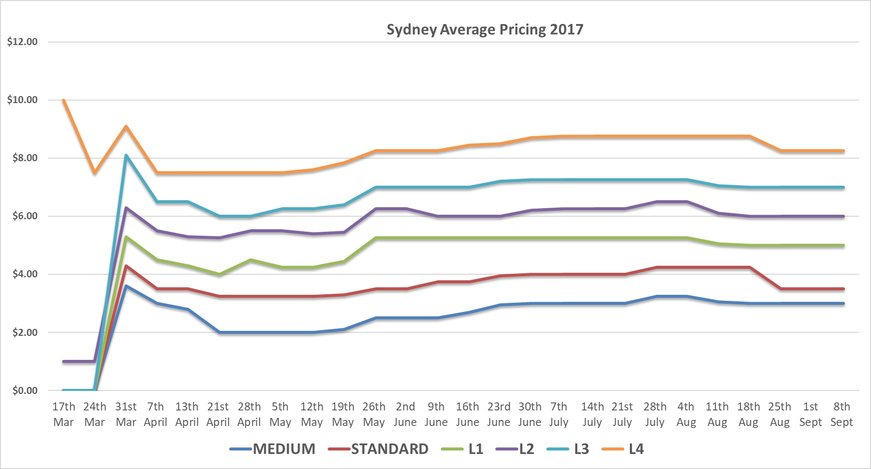
Chart 4
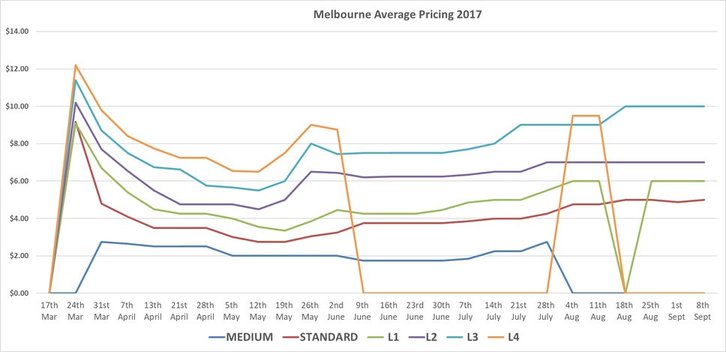
Chart 5
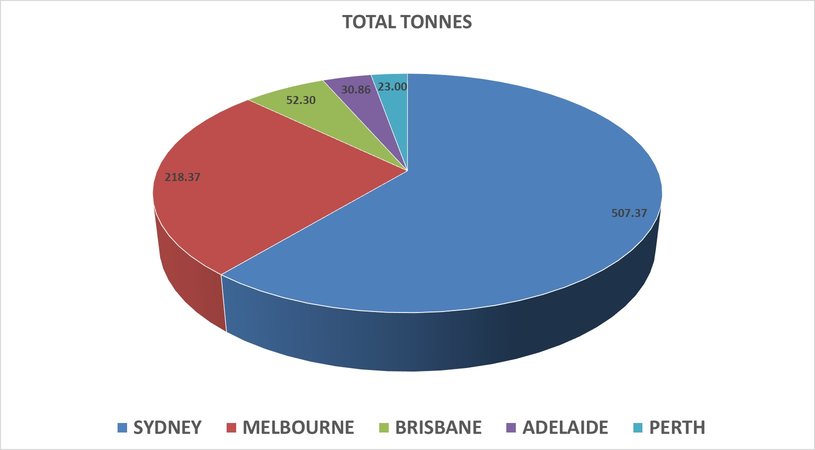
Based on the assumption that 70% of Australian Chestnut production comes from NE Victoria if we extrapolate forward, then the estimated total Australian Chestnut Production for 2017 was at least 1190 tonnes.
